Stability Analysis Improvements
October 30, 2026 · Philip Healy
The Stability Overview on the Sensitivity page now answers a different question: how much would your criteria weights have to change before a different option comes first?
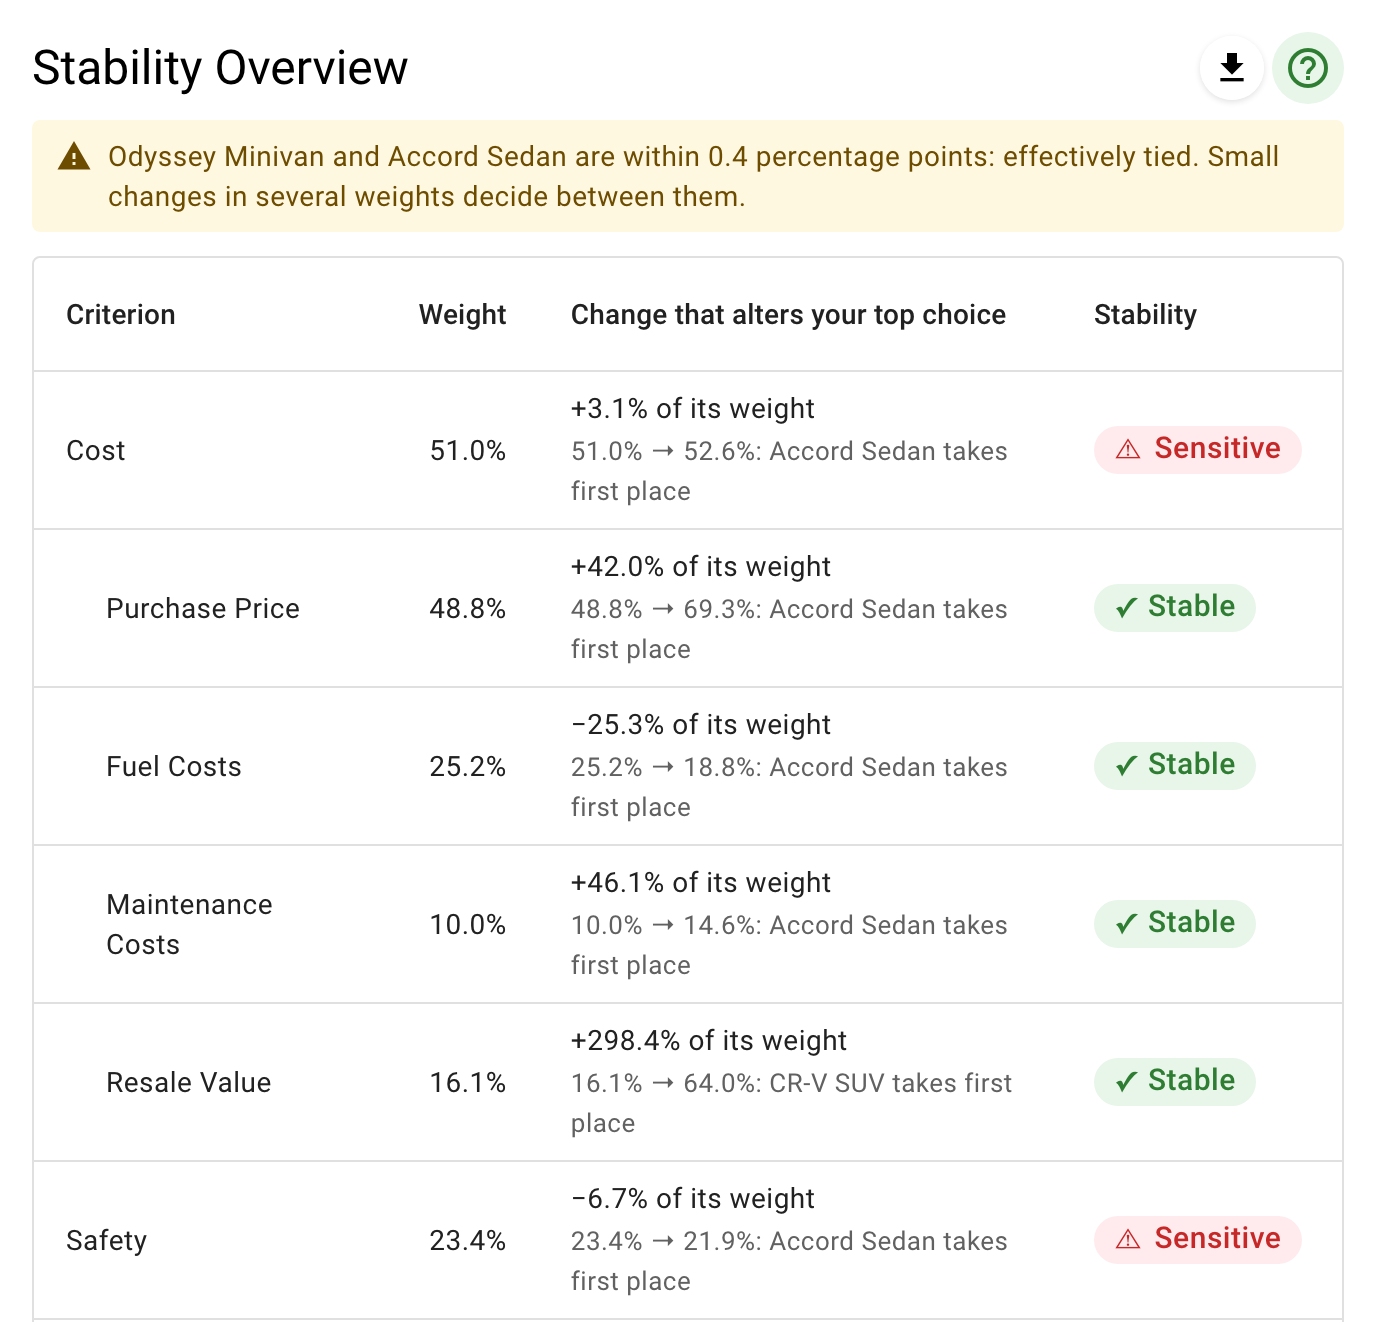
The Sensitivity page has always had a chart for exploring what happens to your results when you change a criterion's weight. Above it sits the Stability Overview, a table that rates every criterion as stable, moderate or sensitive. From today, that table is built on a different, and better, definition of "sensitive".
Limitations of the Old Table
The old rating measured the smallest change to a criterion's weight, in absolute points, that would swap the positions of any two options. That sounds reasonable, but on real decisions it is suboptimal in two ways.
The first is that it ignores where the swap happens. If two options near the bottom of your ranking are close together, every criterion that nudges them past each other gets rated "sensitive", even when your top choice is never in doubt. The second is that absolute points favour small weights. A criterion weighted at 4% looks fragile because a change of two points is a small number, when in fact that change is half of its weight.
The Wikipedia car example shows both problems at once. Here is its Stability Overview as the old table showed it (sub-criteria are marked with ›, and their weights are within their group):
| Criterion | Weight | Critical Δ | Stability |
|---|---|---|---|
| Cost | 51.0% | ±2.0 points | Sensitive |
| › Purchase Price | 48.8% | ±3.2 points | Sensitive |
| › Fuel Costs | 25.2% | ±5.2 points | Sensitive |
| › Maintenance Costs | 10.0% | ±3.0 points | Sensitive |
| › Resale Value | 16.1% | ±8.1 points | Sensitive |
| Safety | 23.4% | ±2.4 points | Sensitive |
| Style | 4.1% | ±1.9 points | Sensitive |
| Capacity | 21.5% | ±2.5 points | Sensitive |
| › Cargo Capacity | 16.7% | ±16.3 points | Moderate |
| › Passenger Capacity | 83.3% | ±16.3 points | Moderate |
Eight of the ten criteria are rated "sensitive". This is a lot of noise, and obscures the most important aspects. Most of the "Sensitive" ratings arise from two cars swapping fourth and fifth place, which probably isn't something that someone choosing a car cares deeply about. Style, the smallest weight, looks like the most fragile criterion of all. And the two sub-criteria that can never change the winning car are rated "moderate".
Turning to the Literature
Studying the table above, it was clear that the existing rating had deficiencies, but it wasn't obvious what the solution should be. Should swaps below first place be ignored altogether? Should a change be measured against the weight itself, or on some other scale? Rather than invent an answer, we turned to the literature, and found that the problem had been studied in depth by Triantaphyllou and Sánchez in a 1997 paper in Decision Sciences.
They point out that any measure of sensitivity has to make two choices. The first is what counts as a change in the result: a different option coming first, or any two options swapping places. The second is how to measure the change to a weight: in absolute points, or relative to the weight itself. When designing our existing table implementation, we had made both choices instinctually by measuring swaps between any pair in absolute points. Seen this way, the two problems in the car example are simply the consequence of making these choices without considering alternative approaches.
The paper also gives reasons to choose differently. For a decision about a single best option, changes at the top are what matter. Relative terms are recommended, because a change of two points means something very different on a weight of 4% than on a weight of 50%. And their computational experiments found that absolute measurement tends to flag the lowest-weight criterion as the most critical, which is exactly what our table did with Style. Combining changes at the top with relative terms gives the measure they call Percent-Top, and that is what the new table uses.
The paper does not give guidance about what bands to use when categorizing stability. We decided on the following: a relative change under 10% is rated sensitive, 10% to 25% moderate, and anything above that stable. The literature ranks criteria by how critical they are and leaves the labelling to you, so treat these rating as a guide and read the numbers beside them.
Another issue arose with subcriteria. The Triantaphyllou and Sánchez paper only covers a single level of criteria. For subcriteria we measure the change relative to the subcriterion's own weight within its group. Because the parent's weight doesn't move, this is the same as the relative change in its overall weight, so top-level criteria and subcriteria can be read on the same scale. If you want to go further, Chen and Kocaoglu (2008) give an algorithm for sensitivity analysis at every level of a hierarchy, including changes to several weights at once.
One more improvement comes free with the new definitions. Because scores move in a straight line as a weight changes, the critical change can be calculated exactly, rather than found by stepping through weights one percent at a time as before. This is most useful precisely when it matters most: when two options are a fraction of a point apart.
How It Works Now
The new rating evaluates each criterion as follows: how far, relative to its current weight, would the weight have to move before a different option comes first? Here is the same decision under the new rating:
| Criterion | Weight | Change that alters the top choice | Stability |
|---|---|---|---|
| Cost | 51.0% | 3.1% of its weight | Sensitive |
| › Purchase Price | 48.8% | 42.0% of its weight | Stable |
| › Fuel Costs | 25.2% | 25.3% of its weight | Stable |
| › Maintenance Costs | 10.0% | 46.1% of its weight | Stable |
| › Resale Value | 16.1% | 298.4% of its weight | Stable |
| Safety | 23.4% | 6.7% of its weight | Sensitive |
| Style | 4.1% | 35.4% of its weight | Stable |
| Capacity | 21.5% | 11.0% of its weight | Moderate |
| › Cargo Capacity | 16.7% | Never | Stable |
| › Passenger Capacity | 83.3% | Never | Stable |
In the app, each row also shows the direction of the change and the option that would take over. Four rows are worth comparing with the old table:
- Cost: increase its weight by about 3% and the Accord Sedan overtakes the Odyssey Minivan.
- Safety: reduce its weight by about 7% and the same thing happens. These are the two genuinely sensitive criteria, and the old table buried them among six others.
- Style: the weight has to rise by about a third before anything changes at the top. Rated stable, where the old table said sensitive.
- Cargo Capacity and Passenger Capacity: no change to either can alter the winning car, and the table now says so plainly.
That leaves two sensitive criteria, one moderate and seven stable, which is a far more accurate picture of this decision than flagging eight as sensitive. The updated view also includes a warning that the old table did not give: the top two cars are only 0.4 percentage points apart, so the page now says so, directly above the table.
The chart below the table, for exploring a criterion's weight by hand, is unchanged.
Questions You Might Have
Will my old stability ratings change? Yes, for most decisions. Criteria that were "sensitive" because of swaps lower down the ranking will usually become stable; the ratings for criteria that can change your top choice are the ones to watch.
Is this a standard method? The measure is the one Triantaphyllou and Sánchez call Percent-Top, and the help text on the page names it, so you can cite it. The bands are ours.
Does this change my results? No. Priorities and rankings are computed exactly as before. Only the stability ratings and the numbers behind them have changed.
What if my options are tied? If two or more options share first place, there is no top choice to test, so the table leaves out the ratings and says why. That includes a new decision whose options haven't been compared yet, which the old table rated as entirely stable.
What about the AI summary on the Sensitivity page? It uses the same definitions and bands, so the summary and the table tell the same story.
Try It Out
The new Stability Overview is live in the app for every decision that has sensitivity analysis: public decisions, and private decisions with a subscription. If you have a decision where the old ratings looked wrong, I would like to hear whether the new ones look better. Use the contact form or email me at philip.healy@decisionpoint.io.
— Philip
References
- Triantaphyllou, E. and Sánchez, A. (1997). "A Sensitivity Analysis Approach for Some Deterministic Multi-Criteria Decision-Making Methods." Decision Sciences, 28(1), 151–194. Authors' copy: bit.csc.lsu.edu/trianta.
- Chen, H. and Kocaoglu, D.F. (2008). "A Sensitivity Analysis Algorithm for Hierarchical Decision Models." European Journal of Operational Research, 185(1), 266–288.
- Chen, H. (2007). "Sensitivity Analysis for Hierarchical Decision Models." PhD dissertation, Portland State University.
- Wikipedia. "Analytic hierarchy process — car example."